2012 | Infographics
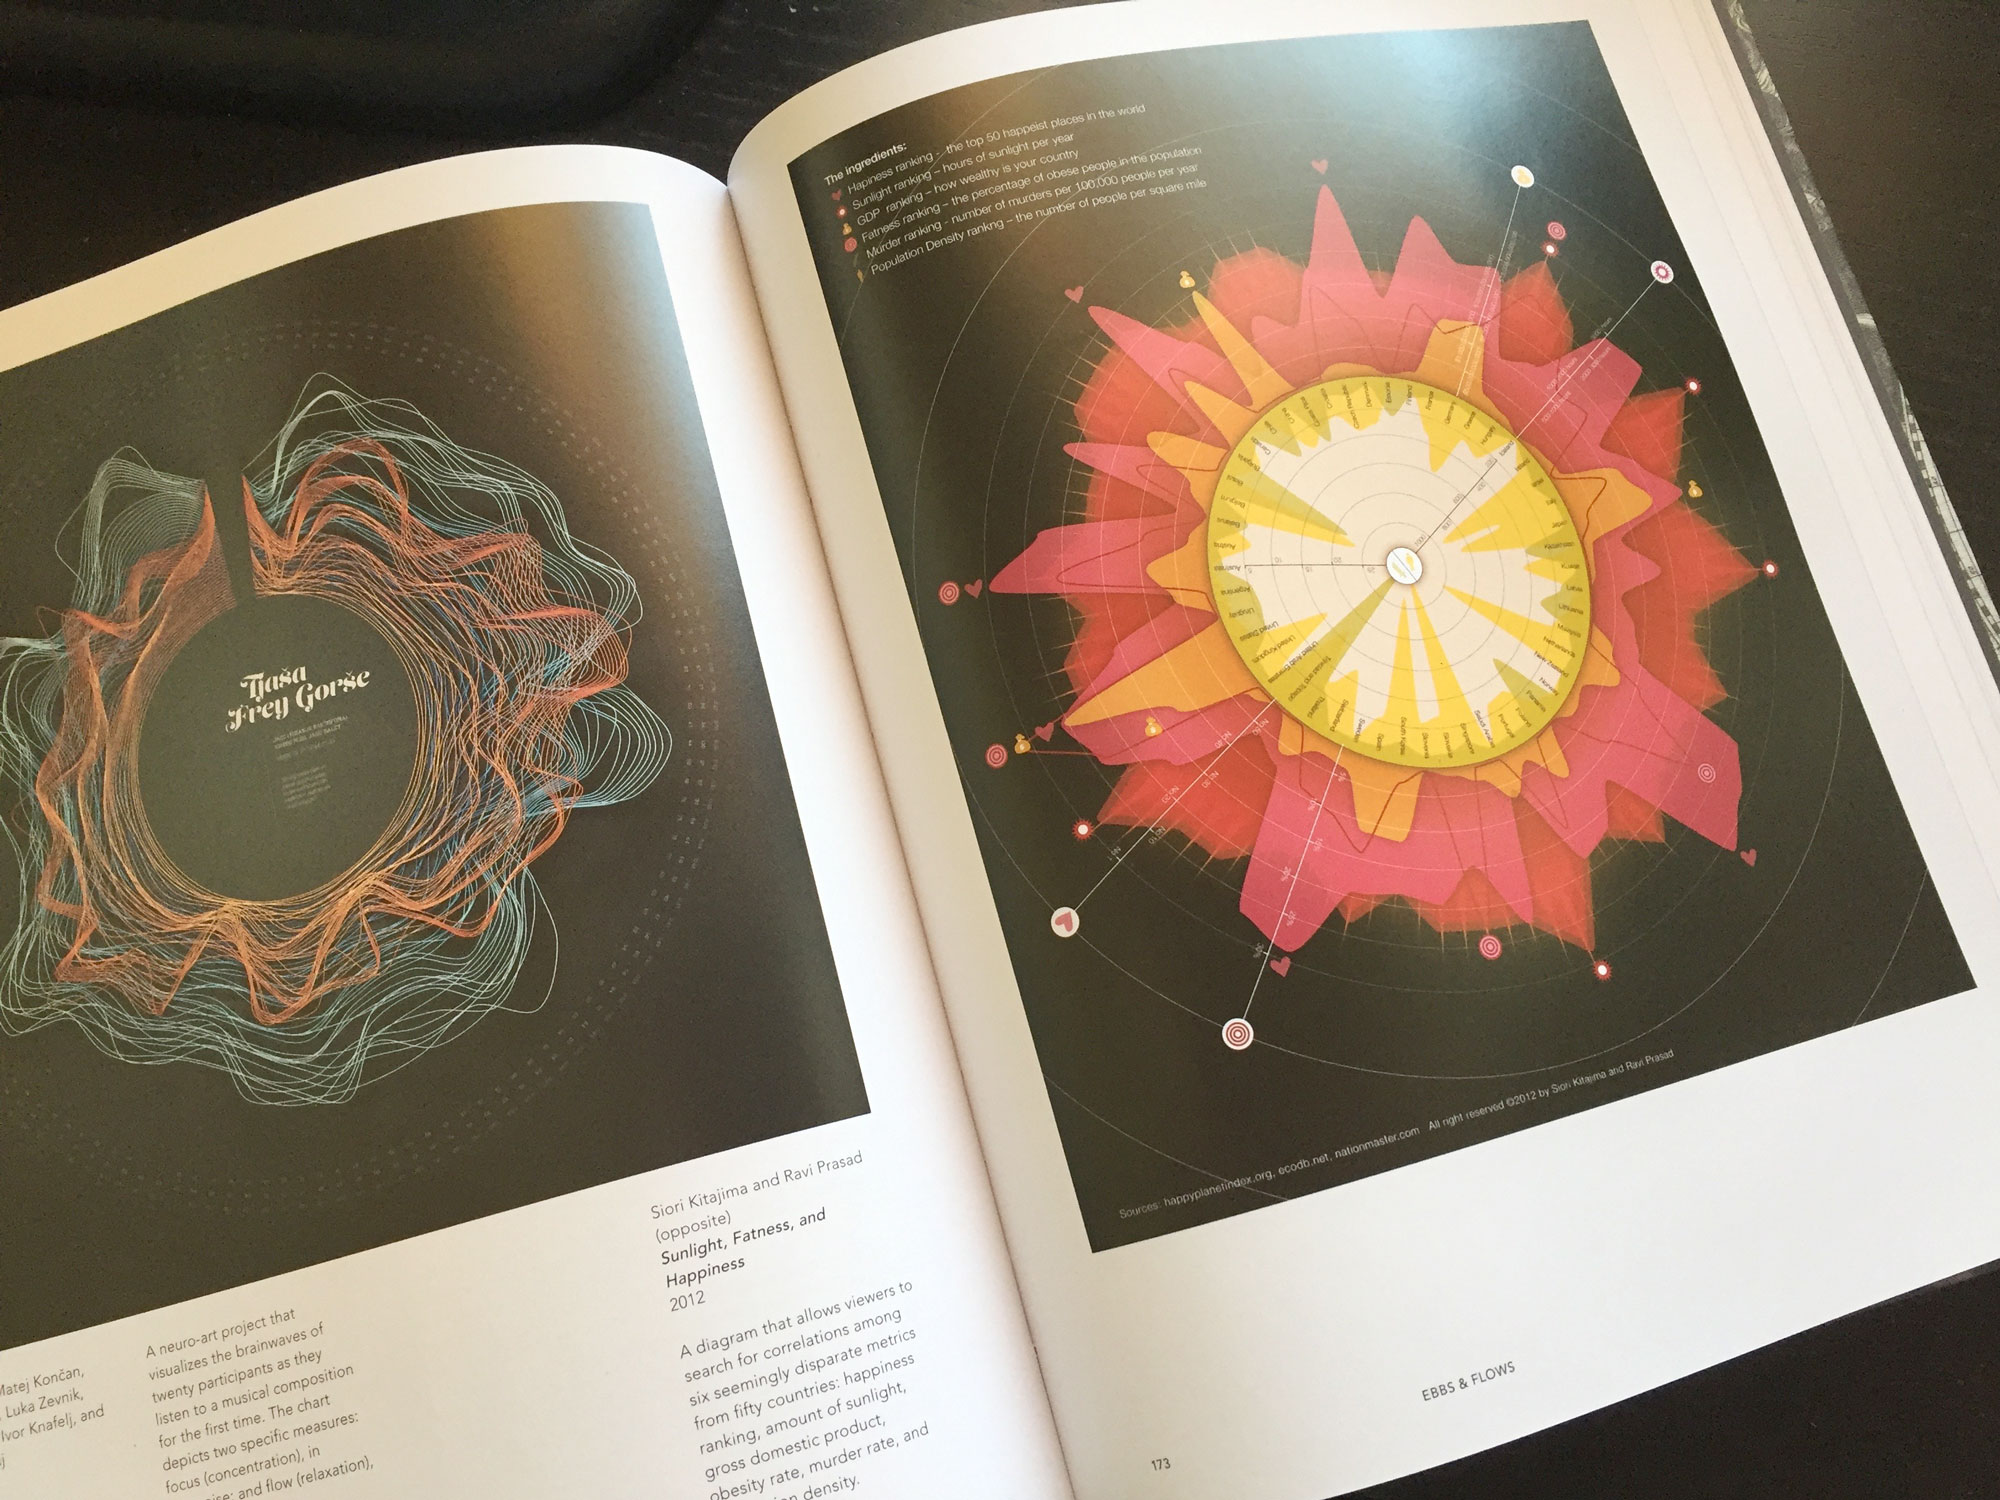
ART : : Siori Kitajima
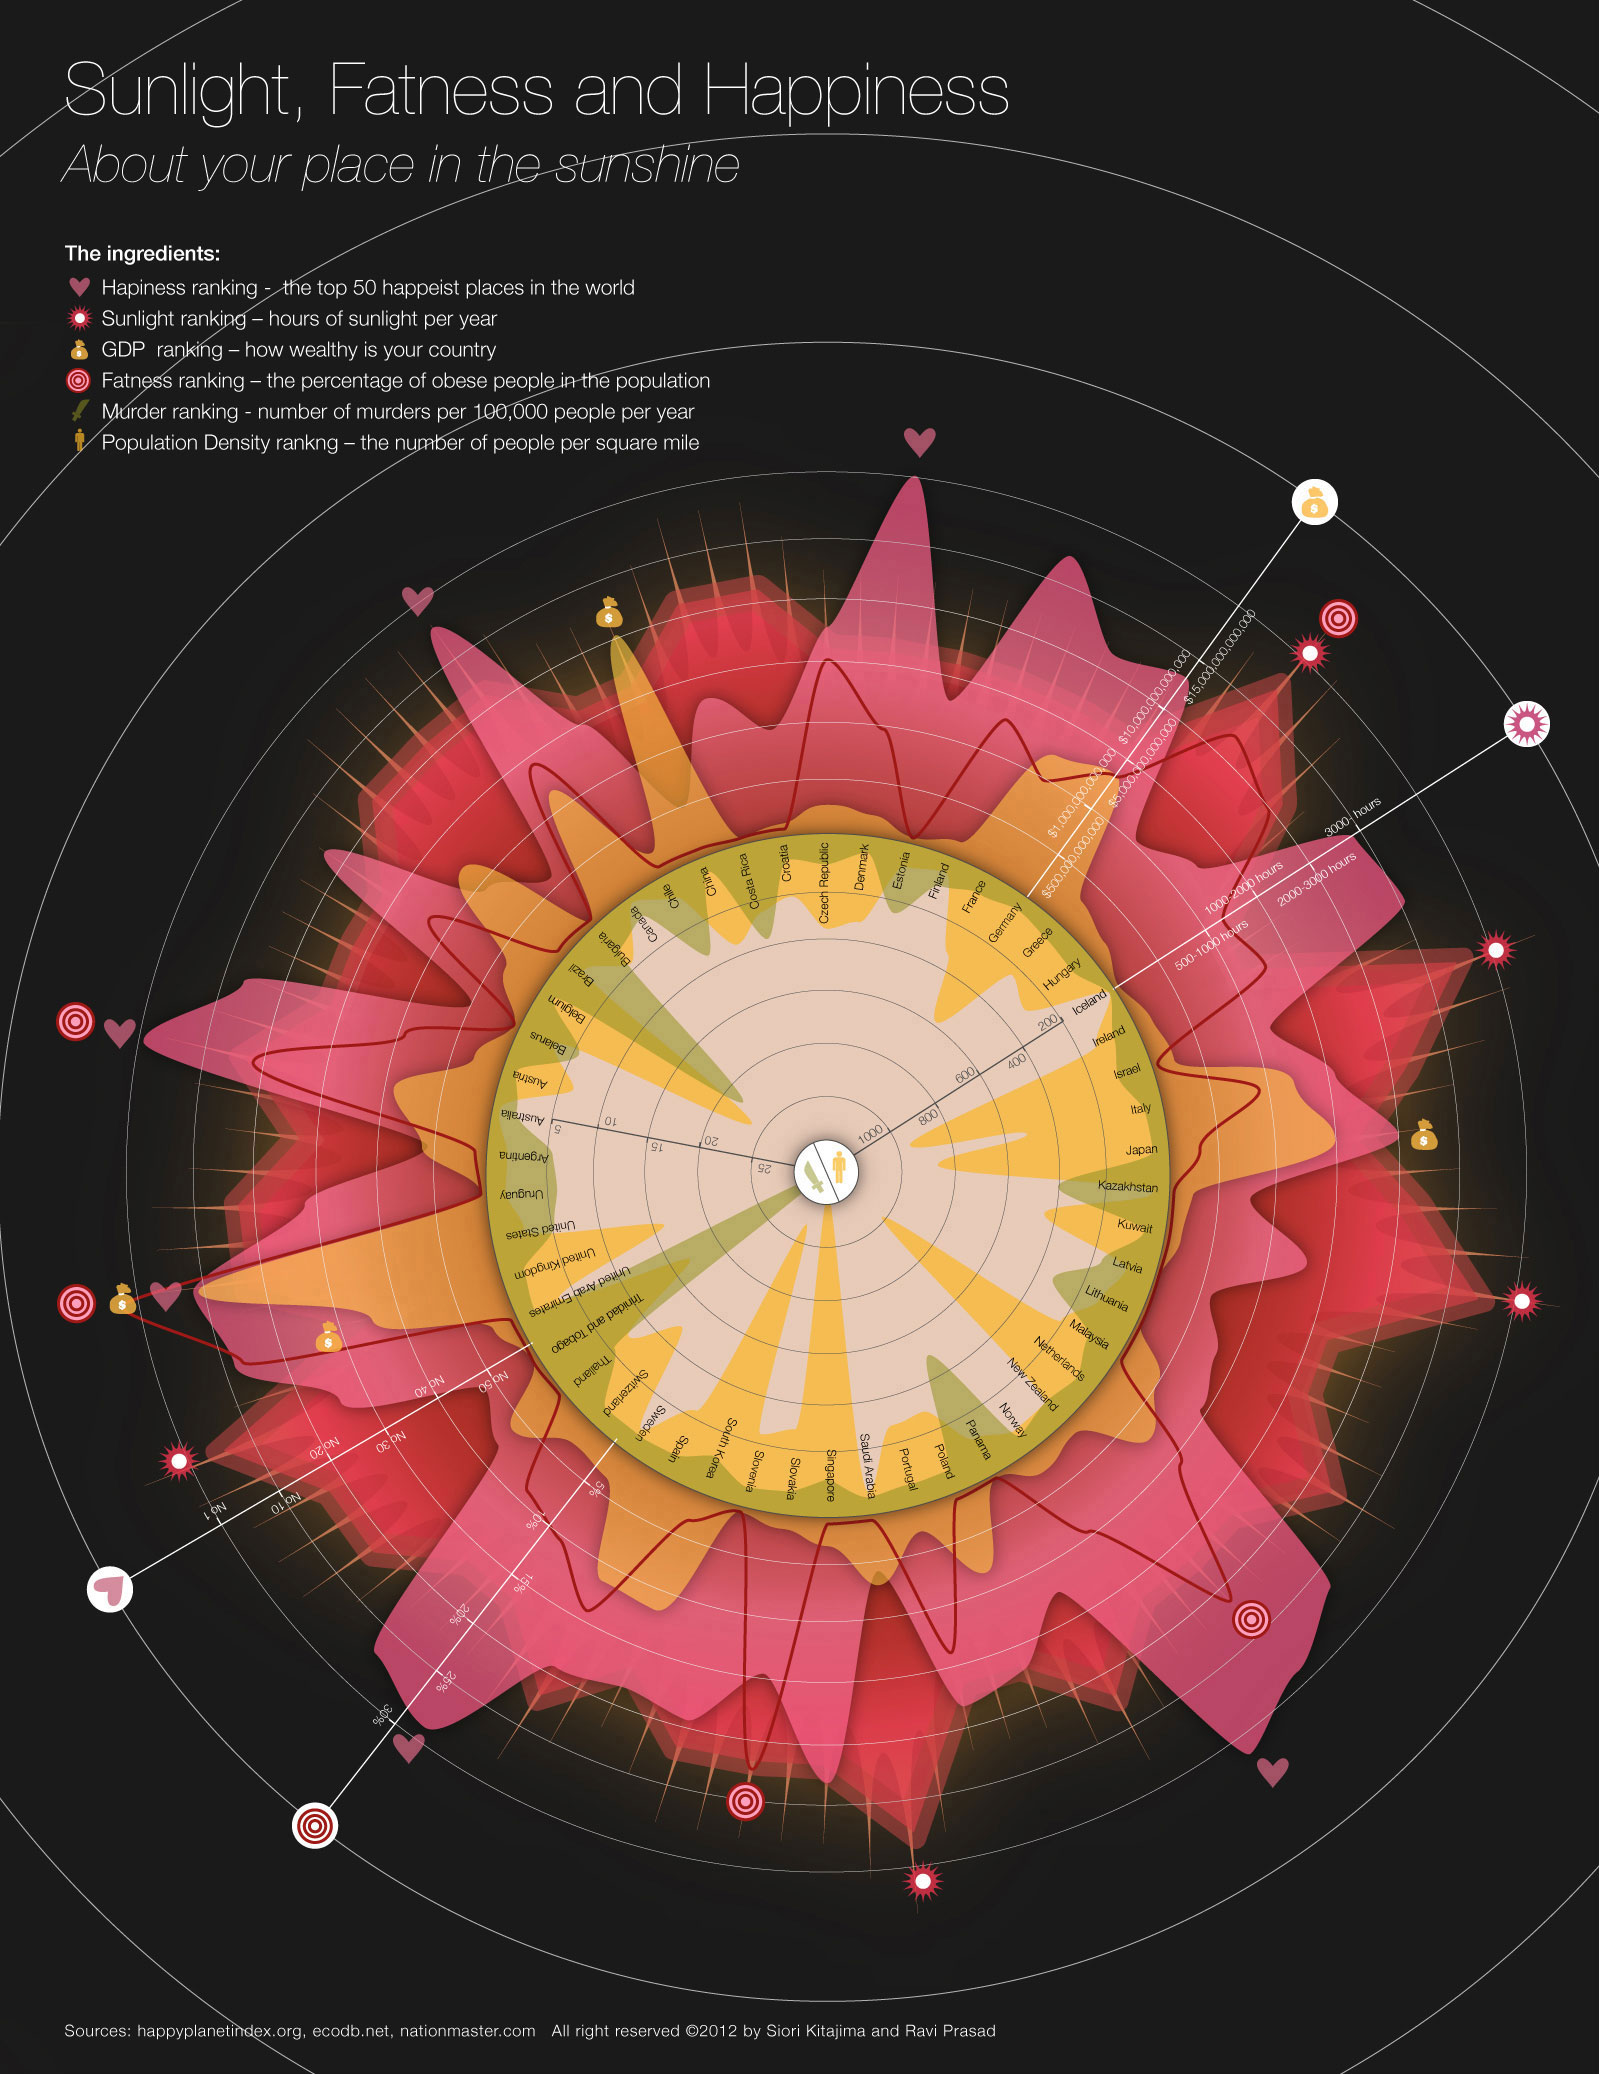
What makes a place a happy place to live - is there really a correlation between sunlight and happiness? Can you be miserable in a sunny country, happy in perpetual twilight? Does a country have to be wealthy to be happy? Are countries with heavier people happier places to live?
You can use this infographic to answer all sorts of interesting questions. Or maybe it raises more questions than it answers. Can you be happy in a place where the murder rate is high? Is there a relationship between murder rates and fatness?
The Sunlight, Fatness and Happiness infographic is all about your little place in the sunshine.
This infographic piece was shortlisted for Information is beautiful awards in 2012.
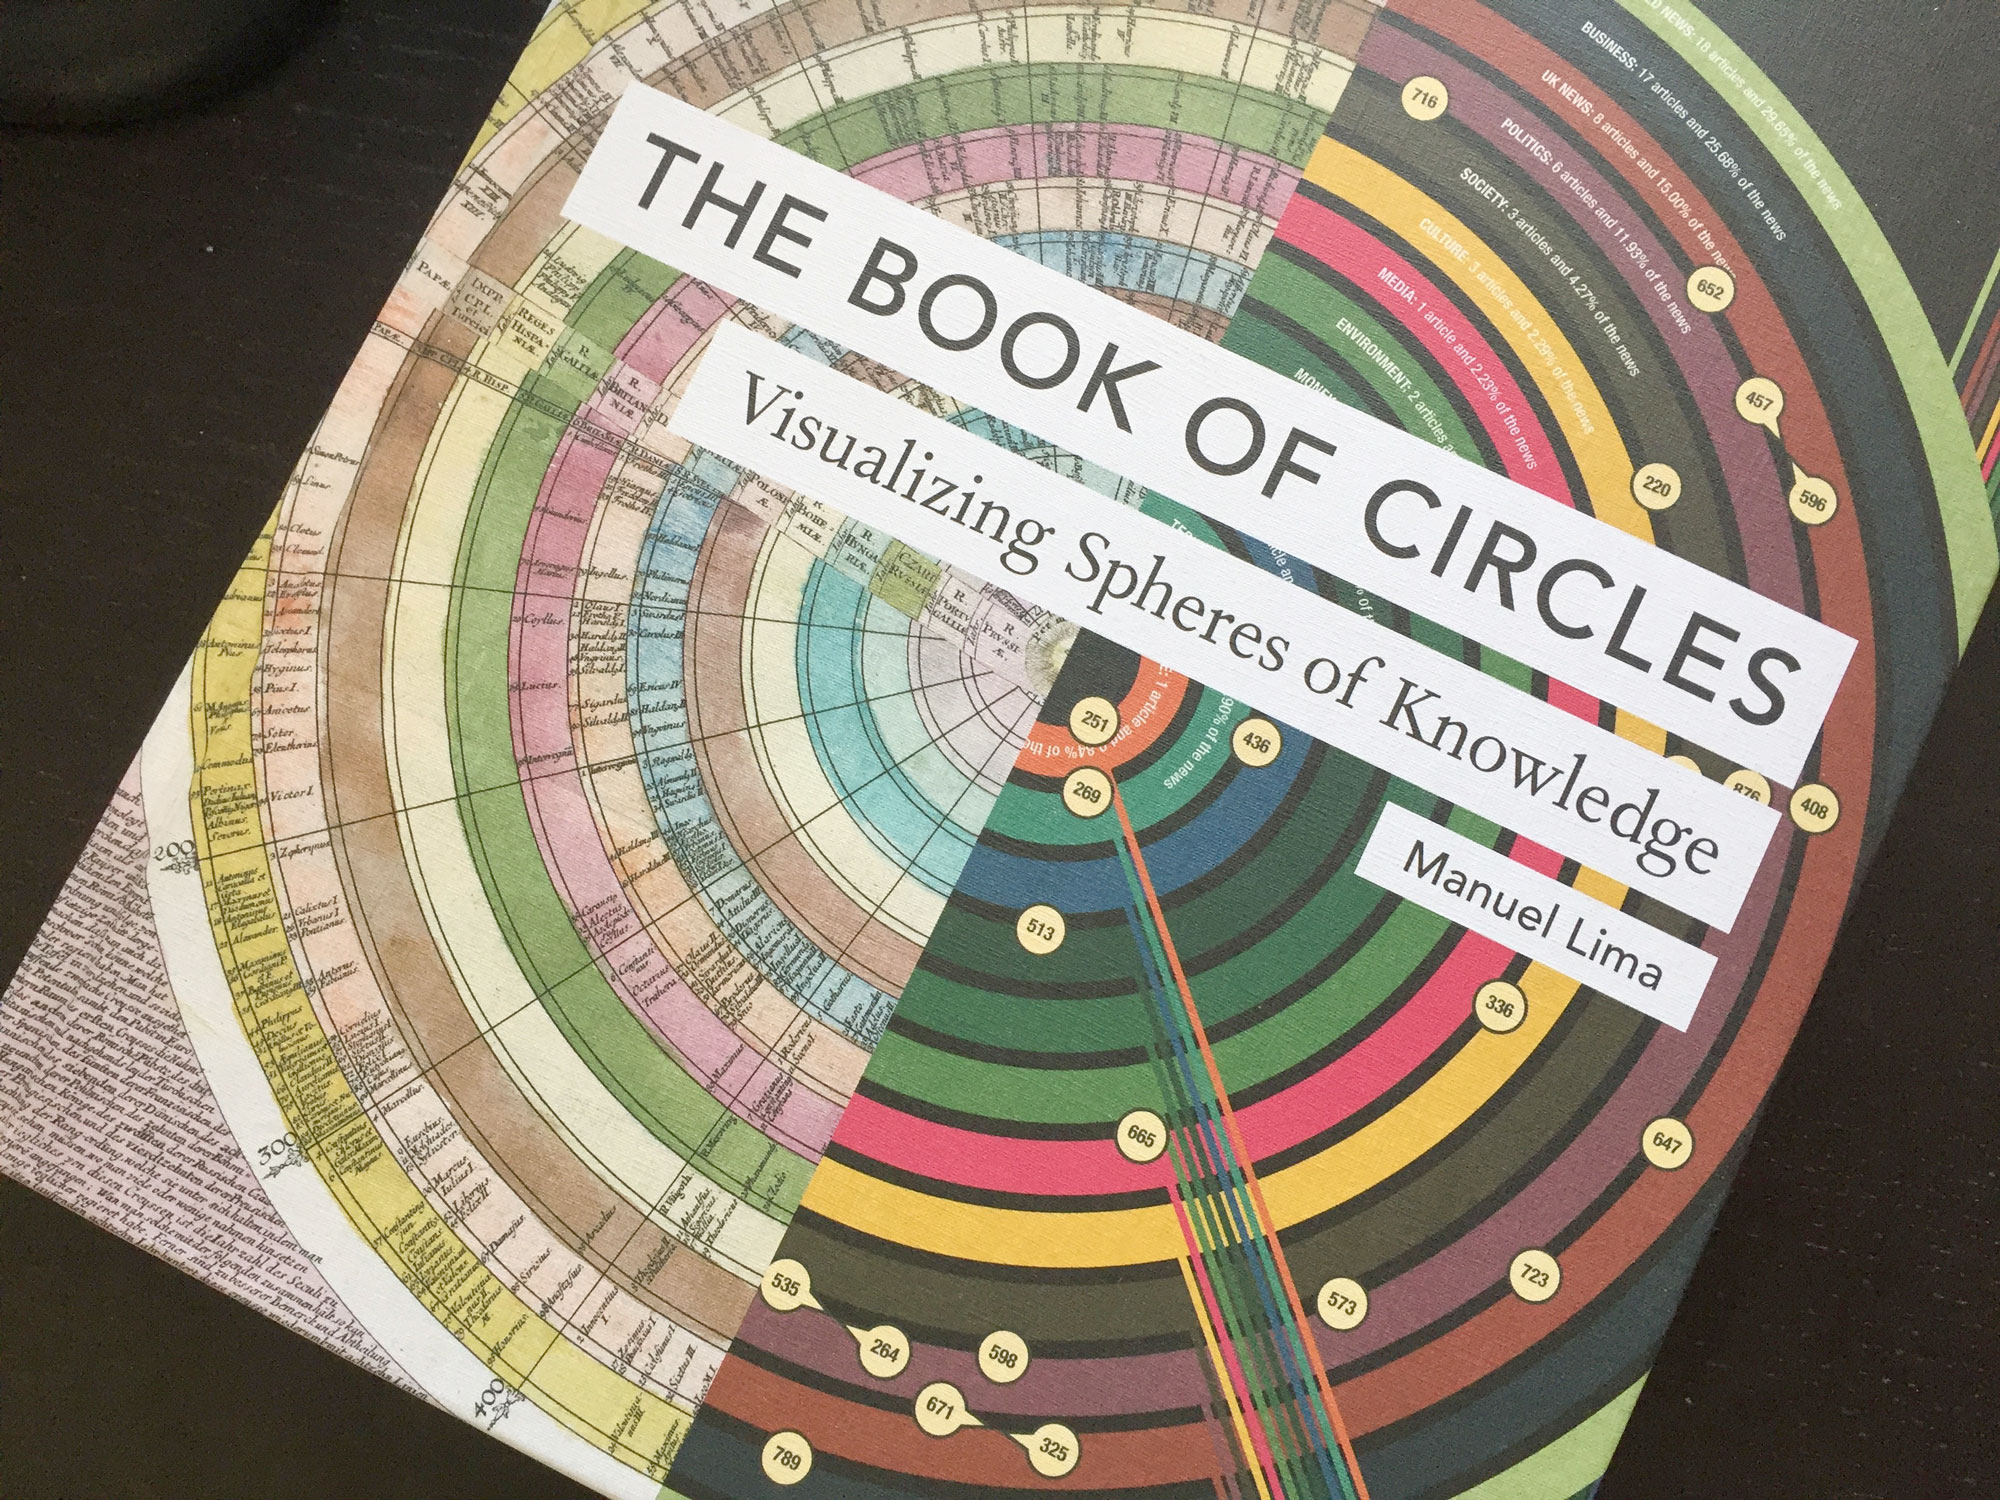
This piece was featured in The Book of Circles: Visualizing Spheres of Knowledge by Manuel Lima, published in 2017.